# Representing Relationships
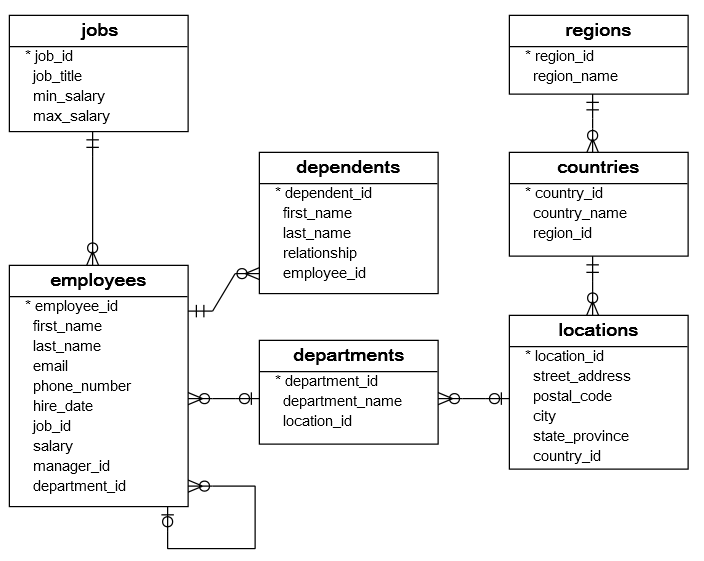
Entity Relationship Diagrams (ERDs) not only show us the entities and their attributes but also how these entities interact with each other. The lines connecting the tables represent these relationships and are necessary to understand the database’s structure. Let’s break down how to read these relationships using the HR database ERD from our previous lessons.
# HR Entity Relationship Diagram

Source: https://www.sqltutorial.org/sql-sample-database/
# Interpreting Relationships
The lines between the tables indicate how the entities relate to each other. You will notice different endings on these lines, such as a single straight line or a forked line. These symbols tell us about the type and direction of the relationship.
# One-to-Many Relationship
Consider the relationship between the employees and jobs tables in the HR Entity Relationship Diagram:
- Single Line: This represents the “one” side of the relationship.
- Forked Line: This symbolizes the “many” side of the relationship.
This is known as “Crow’s Foot Notation” and is widely used in database diagraming.
When we read the diagram:
- From Jobs to Employees: Each job can have many employees. This is because the line ends with a forked symbol at the
employeestable. - From Employees to Jobs: Each employee has only one job, indicated by the single line ending at the
jobstable.
This visualization helps us understand that each employee is associated with one job and each job title can be held by multiple employees.
# Employees-Dependents Example
Now, let’s look at the relationship between employees and dependents. Based on the HR Entity Relationship Diagram, what is the relationship between these two table? Try to find out for yourself before continuing.
To understand the relationship, do the following:
- Look at the
employeestable. The line connecting it todependentsends with a pronged line at thedependentstable. This indicates that an employee can have many dependents. - Now, examine the
dependentstable. The line connecting it toemployeesends with a single straight line. This indicates that a dependent can only have one employee.
This relationships is also suggested by the structure of the table itself. We can see that dependents has a column for employee_id, suggesting that each dependent can be linked to a single employee.
# Practice Questions
- What is the relationship between
regionsandcountries? What steps did you take to determine this from the diagram? - What is the relationship between
departmentsandemployees? What steps did you take to determine this from the diagram?